Swift/UVOT Grism Monitoring of NGC 5548 in 2013: An Attempt at MgII Reverberation Mapping
Cackett, E. M.; ; Bentz, M. C.; et al.
The Astrophysical Journal, Volume 810, Issue 2, article id. 86, 8 pp. (2015).
Reverberation-mapping-based scaling relations are often used to estimate the masses of black holes from single-epoch spectra of active galactic nuclei (AGNs). While the radius-luminosity relation that is the basis of these scaling relations is determined using reverberation mapping of the Hβ line in nearby AGNs, the scaling relations are often extended to use other broad emission lines, such as Mg ii, in order to get black hole masses at higher redshifts when Hβ is redshifted out of the optical waveband. However, there is no radius-luminosity relation determined directly from Mg ii. Here, we present an attempt to perform reverberation mapping using Mg ii in the well-studied nearby Seyfert 1 NGC 5548. We used Swift to obtain UV grism spectra of NGC 5548 once every two days from 2013 April to September. Concurrent photometric UV monitoring with Swift provides a well determined continuum light curve that shows strong variability. The Mg ii emission line, however, is not strongly correlated with the continuum variability, and there is no significant lag between the two. We discuss these results in the context of using Mg ii scaling relations to estimate high-redshift black hole masses.
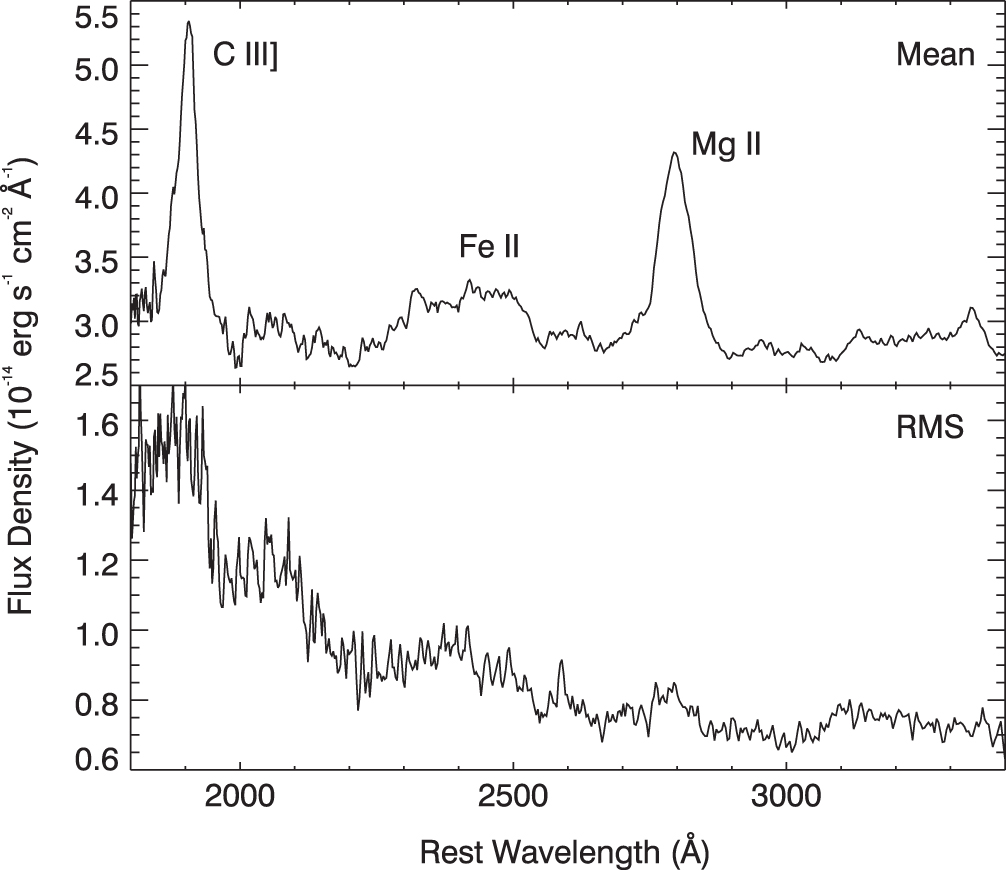
Mean and RMS spectrum of NGC 5548
Top: mean UV grism spectrum of NGC 5548. The C iii] and Mg ii emission lines are clearly visible. The Fe ii emission line complex extends either side of the Mg ii line but is most prominent from 2200–2800 Å. Bottom: root mean square UV grism spectrum of NGC 5548.
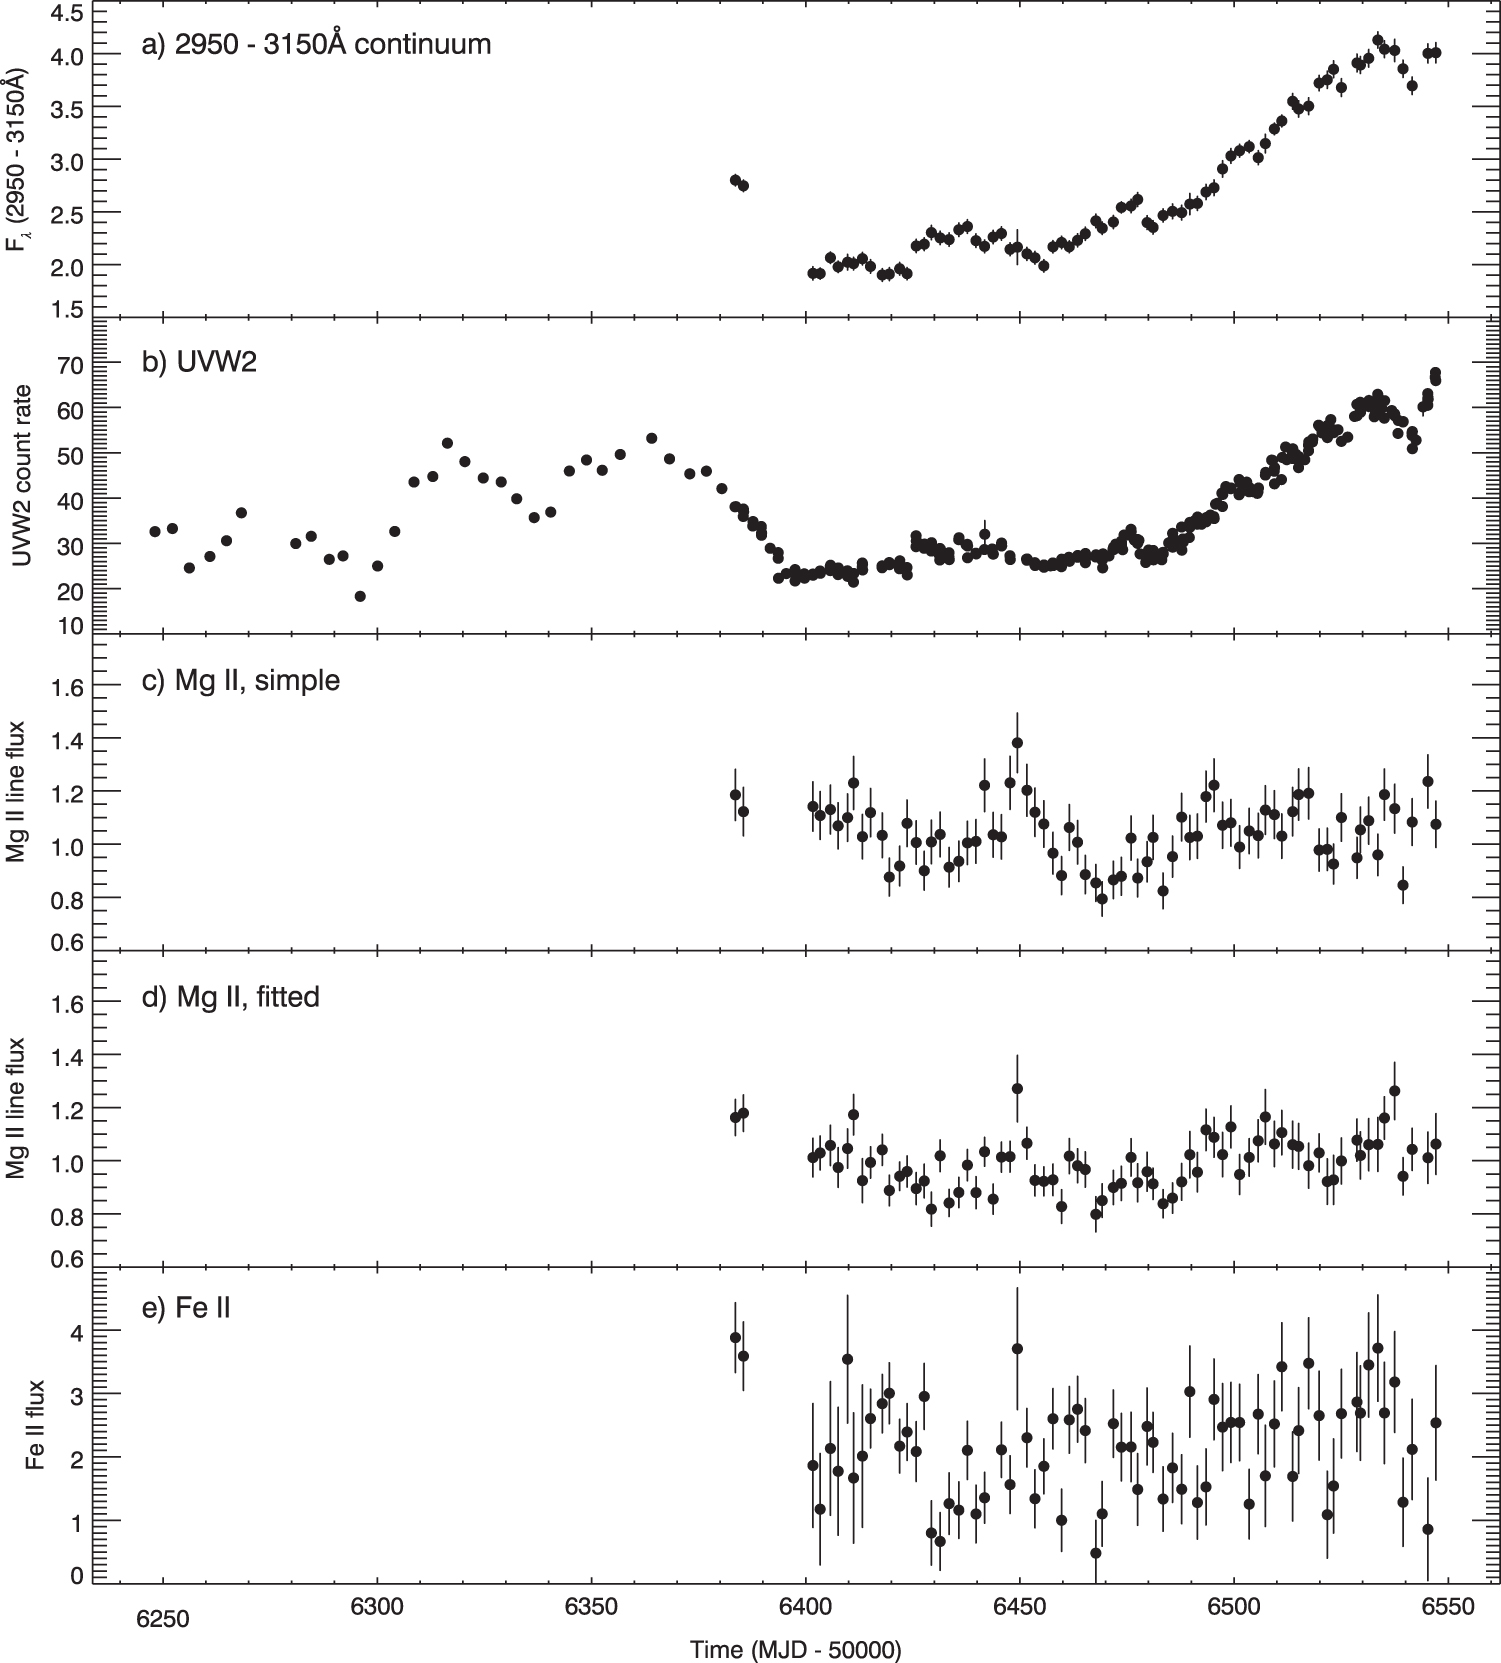
NGC 5548 light curves
(a) Average flux density between 2950 and 3150 Å in units of \[10^{−13}\ \mathrm{erg\ s^{−1}\ cm^{−2}\ Å^{−1}\]. (b) Swift/UVW2 count rate in counts per second. (c) Integrated Mg ii line flux in units of 10−12 erg s−1 cm−2 from the simple approach to determining the Mg ii line flux. (d) Integrated Mg ii line flux in units of 10−12 erg s−1 cm−2 from the Fe template fitting approach to determining the Mg ii line flux. (e) Fe ii flux integrated over the 2000–3000 Å region in units of 10−12 erg s−1 cm−2 determined from Fe template fitting.
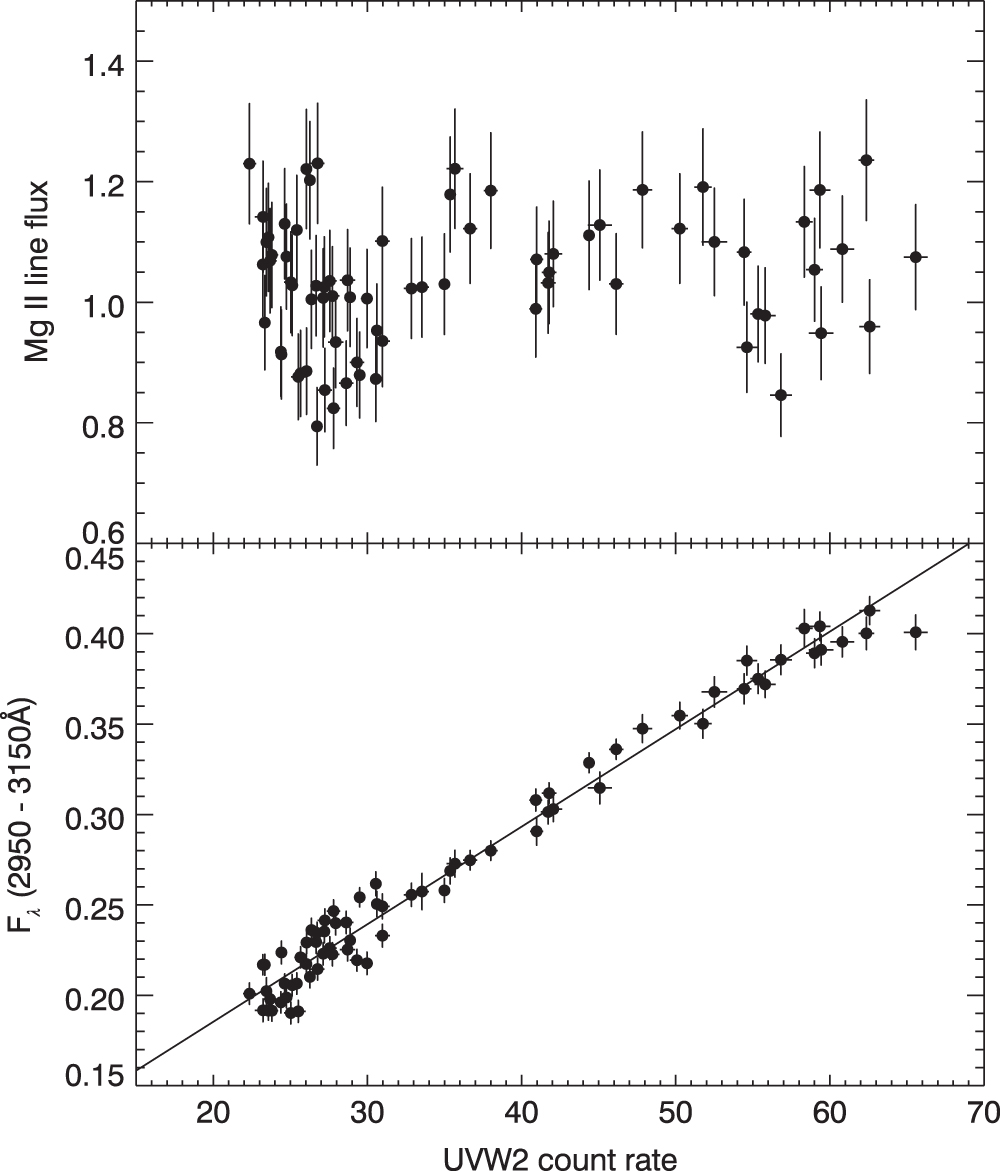
line flux and continuum flux vs UV count rate
Top: Mg ii line flux (10−12 erg s−1 cm−2) from the simple method vs. UVW2 count rate (c/s). No correlation is apparent. Bottom: 2950–3150 Å flux density (10−13 erg s−1 cm−2 Å−1) vs. UVW2 count rate. There is a clear, strong correlation, with the best-fitting straight line shown.
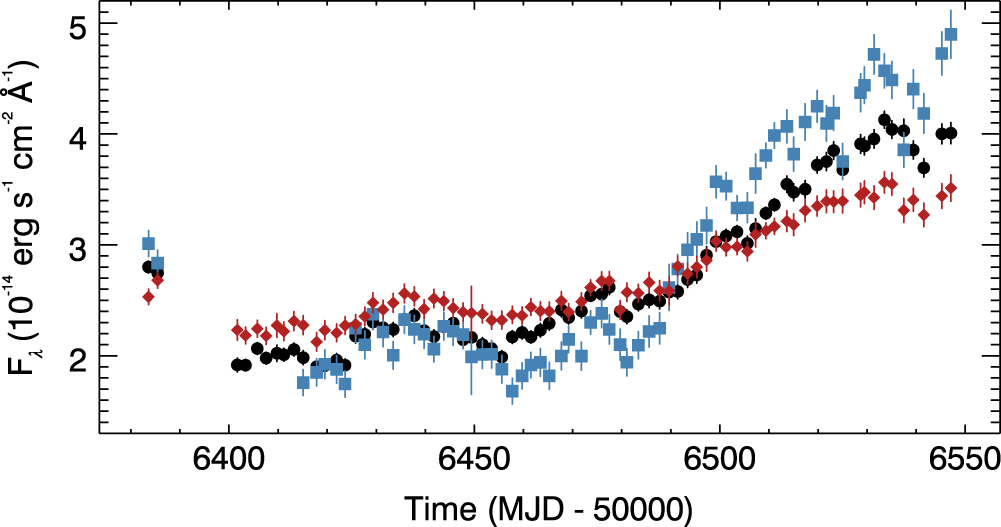
NGC 5548 continuum light curves
Continuum light curves from the U grism in 2015–2215 Å (blue squares), 2950–3150 Å (black circles), and 4430–4625 Å (red diamonds). They are all clearly correlated, but there is no significantly detected lag. The amplitude of variability decreases with increasing wavelength, as expected for disk reverberation.
This paper shows that despite having good temporal coverage with Swift/UVOT UV grism (and a little bit of bad luck), it was not possible to get a lag from the Mg II line.