kg
  • Home
  • Research
  • Group
  • CV
    • Publications
    • Grants & Awards
    • Talks
  • News
  • Contact
  • Home
  • Research
  • Group
  • CV
    • Publications
    • Grants & Awards
    • Talks
  • News
  • Contact

Observational

  • Home
  • Research
  • Category: Observational
  • Announcements
  • BAYMAX
  • Binary SMBH
  • Black Hole Mass
  • Chandra
  • COS
  • Dual AGN
  • gravitational waves
  • HST
  • Magellan
  • Meetings
  • NANOGrav
  • Observational
  • Optical
  • Radio
  • Reverberation Mapping
  • STIS
  • Swift
  • Tests
  • Theory
  • UV
  • UVOT
  • VLA
  • WFC3
  • X-ray
  • X-ray
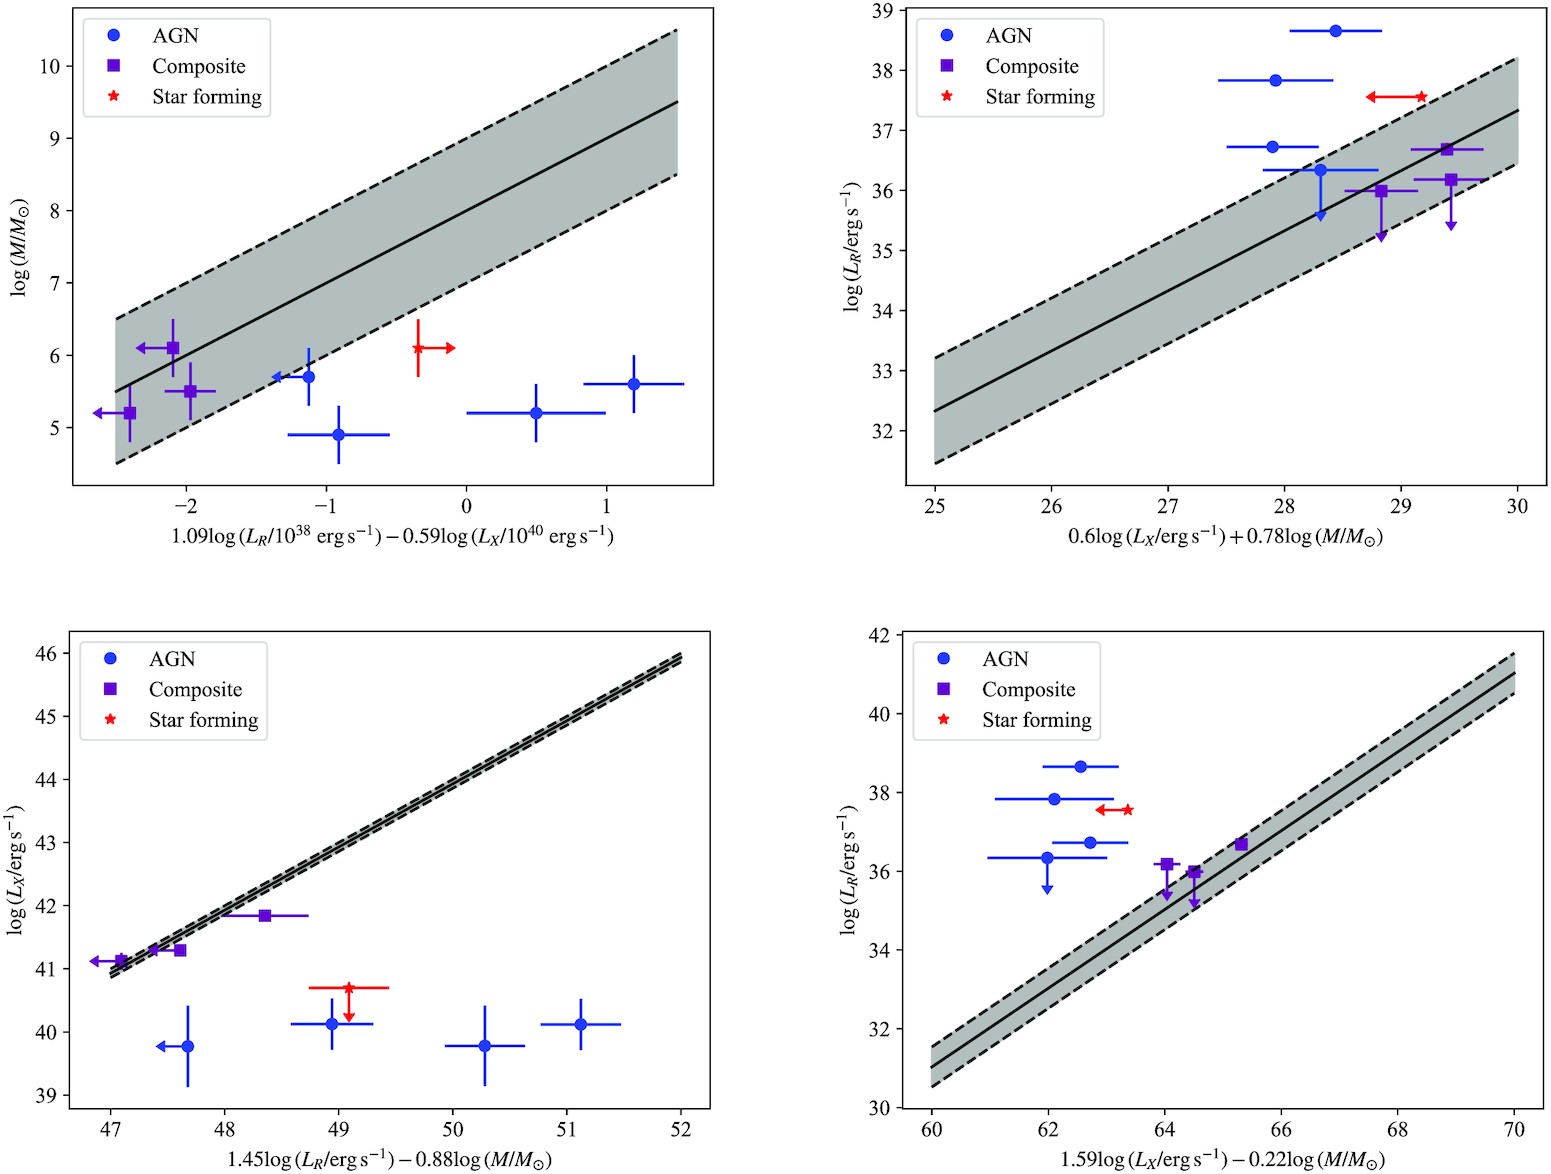
4 panels showing various fundamental plane fits with data that mostly disagree.

High-Eddington Rate IMBHs Do Not Fall on the Fundamental Plane

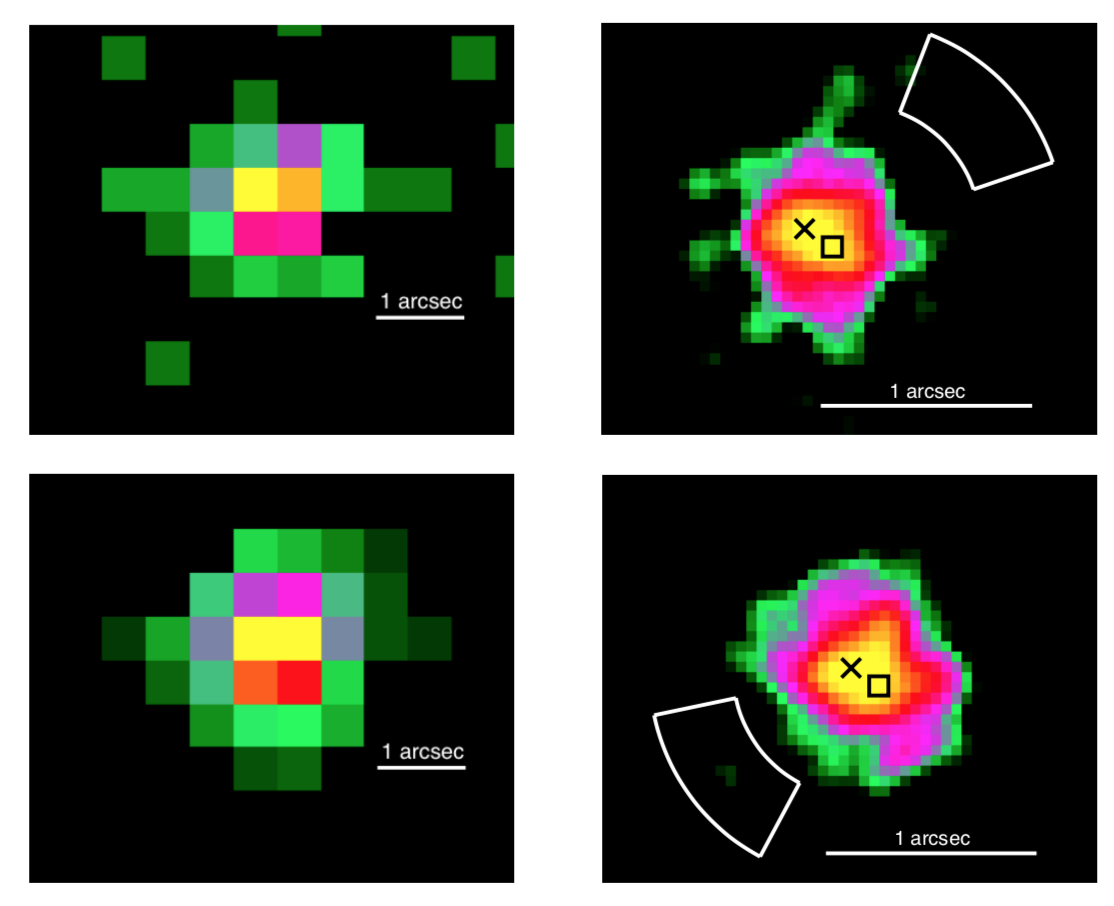
Two by two panels. Left two panels show blocky, pixelated image of indistinct pattern peaking at the center and a line spanning approximately two pixels and labeled "1 arcsec". The right two panels show a much finer resolution version of the same with a black x and a black square at the center of the peaked distribution. The top panel has an arc-like shape in the upper right, the bottom has the same shape in the lower left.

Low-mass dual candidate is lone black hole

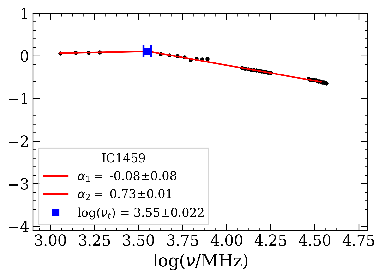
Figure showing log of flux density in Jy as a function of log of frequency in MHz. The y-axis ranges from -4 to 1. The x-axis ranges from 3.0 to 4.75. The data from x = 3.0 to 3.505 are flat at about y = 0. The data from x = 3.505 to 4.6 are going down. The legend indicates that the source is IC 1459, that the low-frequency spectral index is -0.08 +/- 0.08, the high-frequency spectral index is 0.73 +/- 0.01, and the log of the turnover frequency is 3.55 +/- 0.022.

Turnover Frequency

Three-dimensional view of fundamental plane of black hole accretion. A cube is labeled with the following orthogonal axes and limits. X-axis: Radio [erg/s] 30–45; Y-axis: X-ray [erg/s] 30–45; Z-axis: Mass [solar] 0–15. A light blue plane cuts through data points which are clustered as red spheres at the high-mass end and blue cubes and cones at the low mass end.

Measuring black hole masses with X-ray and Radio observations

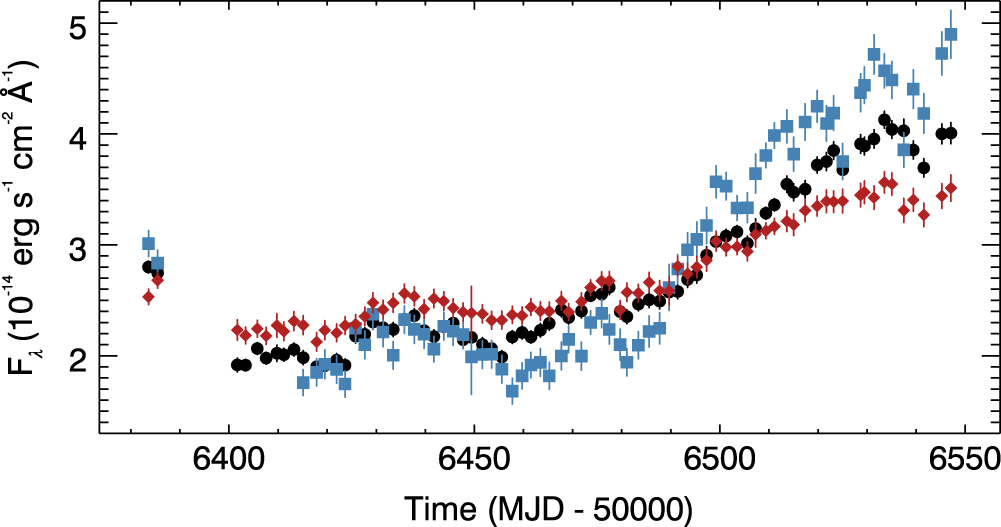
Figure with y-axis as flux density ranging from about 1.5e-14 to 5e-14 erg / s / cm^2 / angstrom and x-axis is time (MJD - 50000) from about 6300 to 6550. There are three sets of points, red, black, and blue with error bars. the prevailing trend from left to right is flat and then increasing.

No lags from Mg II monitoring campaign

view more
Kayhan Gültekin

Astrophysicist

About my research

Address:1085 S. University Ave
West Hall 313
Ann Arbor, MI 48109, USA

Phone:+1 734.255.7082

Email:kayhan@figureitout.edu

  • Home
  • Research
  • Group
  • CV
    • Publications
    • Grants & Awards
    • Talks
  • News
  • Contact

HTML5 theme by xBoot, converted to WordPress theme by Kayhan Gültekin