I am pleased to announce that Cayenne Matt’s latest paper—Inferring MBH–Mbulge Evolution from the Gravitational-Wave Background—has been officially published in The Astrophysical Journal. This work addresses a major question in modern multi-messenger astronomy: why is the observed gravitational-wave background (GWB) amplitude significantly higher than standard astrophysical models predict?
By comparing semi-analytic models with the observed GWB spectrum, Cayenne’s results suggest that to reproduce the GWB amplitude seen by pulsar timing arrays, one must either assume a significantly higher number density of massive galaxies at high redshift than previously thought, or allow for a positively evolving MBH–Mbulge relation. Specifically, the study finds evidence that the MBH/Mbulge ratio may have been higher in the past, evolving as α(z) = α0(1+z)1.04±0.5.

Full Citation: Matt, C. et al. 2026, ApJ, 997, 188.
DOI:10.3847/1538-4357/ae2480
NASA ADS:2026ApJ…997..188M

I am thrilled to highlight the exceptional work of CJ Harris, who has just submitted a significant new paper to AAS Journals. CJ is currently a PhD candidate at the University of Michigan and is officially on the postdoc market (see their CV). Their latest research provides a critical analysis of how stellar scattering is likely to be insufficient on its own to explain how supermassive black hole binaries harden.
Breaking the “Final Parsec” Bottleneck
Although we are now reasonably certain that supermassive black holes form binaries that harden sufficiently to coalesce through gravitational wave emission, the exact solution to the “Final Parsec Problem” is unknown to us, if not to nature.
In their new paper, “Core Scouring Dynamics and Gravitational Wave Consequences: Constraints on Supermassive Black Hole Binary Hardening,” CJ and collaborators (Laura Blecha and I) use a multi-messenger approach to tackle this. By making use of merger trees from the IllustrisTNG cosmological simulations with physically motivated models of core scouring, they were able to see how efficient stellar scattering is in hardening binaries. They were able to reproduce the relationship between mass deficit and galaxy total stellar mass, but only if scattering is more efficient than previously expected. But they were not able to reproduce the nanohertz gravitational wave background with the same efficiency. Meaning that there must be some other source of hardening, most likely gas hardening. If gas hardening plays a dominant role, then we can be far more optimistic about finding binary AGN.

Key takeaways from the work:
- Efficiency Gap: To match observations of real galaxies, the process of binary hardening via stellar scattering must be 1.6x faster than previous N-body experiments suggested.
- The Role of Gas: Most importantly, the paper demonstrates that even the most efficient stellar scattering cannot fully explain the low-frequency turnover in the gravitational wave background.

The “Bright” Side: This strongly suggests that gas dynamics must play a dominant role in bringing these giants together—providing a reason to be optimistic about finding electromagnetically visible binary AGN.
Community Leadership & Presence
Beyond the data, CJ continues to be a leader in the broader physics community. This past November, they presented these findings at the National Society of Black Physicists (NSBP) 2025 Annual Meeting. Their talk, “Multimessenger Constraints on the Supermassive Black Hole Binary Hardening Timescale,” was a deep dive into these results and showcased their ability to bridge complex theory with observational reality.
I am thrilled to announce that CJ Harris has been voted in as a full member of the North American Nanohertz Observatory for Gravitational Waves (NANOGrav). As a dedicated and innovative researcher in our astronomy and astrophysics program, CJ has significantly contributed to advancing our understanding of binary supermassive black holes through a multimessenger approach. Their hard work and collaborative spirit have not gone unnoticed, and this membership is a testament to their commitment and potential within the gravitational wave science community. Congratulations, CJ, on this well-deserved achievement!
This week has been NANOGrav week at U-M! We are hosted the NANOGrav 2024 Fall Collaboration Meeting at Palmer Commons. This week’s Astronomy Colloquium will be given by Joe Simon (U. Colorado) talking about the astrophysics of gravitational wave background. Monday’s High Energy / Astrophysics Seminar in the Physics Department was given by Jeff Hazboun (Oregon St. U.) talking about pulsar timing array detector characterization and optimization.
Over the weekend there was a student workshop. The meeting proper saw roughly 90 people in-person coming through Ann Arbor and many talks. In particular, Cayenne Matt gave a talk titled “Insights into SMBH-Galaxy Co-Evolution From the GravitationalWave Background” and CJ Harris gave a talk titled “Echoes from the Core: Constraints on the Supermassive Black Hole BinaryPopulation from Core Galaxy Properties”.

A huge congratulations to former undergraduate group member Dr. Erica Hammerstein, who successfully defended her dissertation, titled “Population Studies of Tidal Disruption Events and Their Hosts: Understanding Host Galaxy Preferences and the Origin of the Ultraviolet and Optical Emission”.
The NANOGrav results keep on coming out! The following papers were officially published in the past few weeks.
- The NANOGrav 12.5 yr Data Set: Search for Gravitational Wave Memory
- The NANOGrav 12.5 yr Data Set: A Computationally Efficient Eccentric Binary Search Pipeline and Constraints on an Eccentric Supermassive Binary Candidate in 3C 66B
- The NANOGrav 15 yr Data Set: Search for Transverse Polarization Modes in the Gravitational-wave Background
I forgot to mention that I am now a full NANOGrav member! (As of several months ago now.)
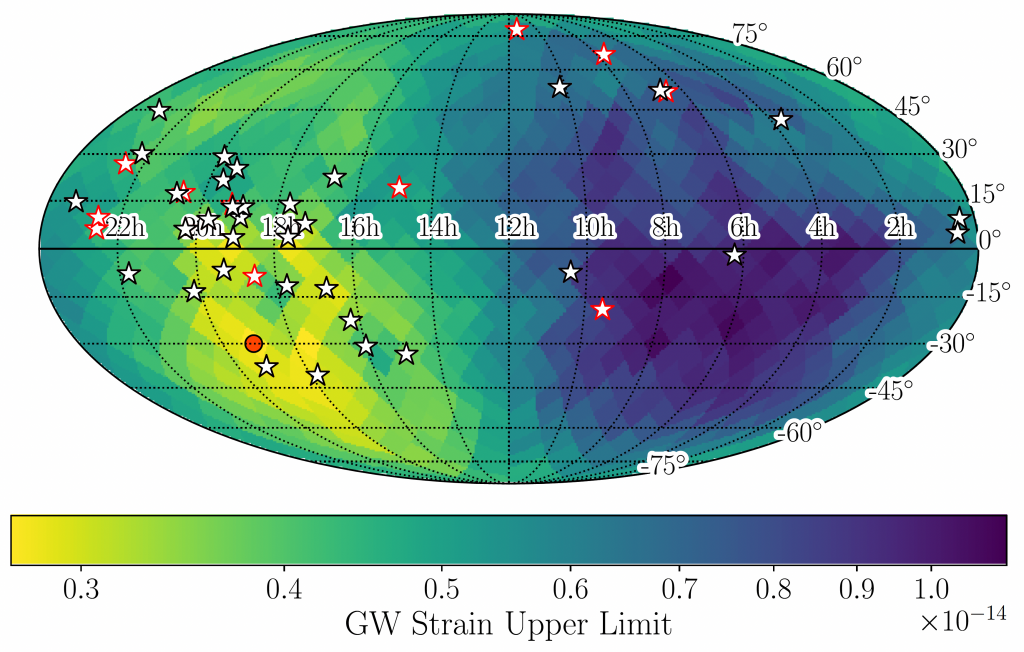
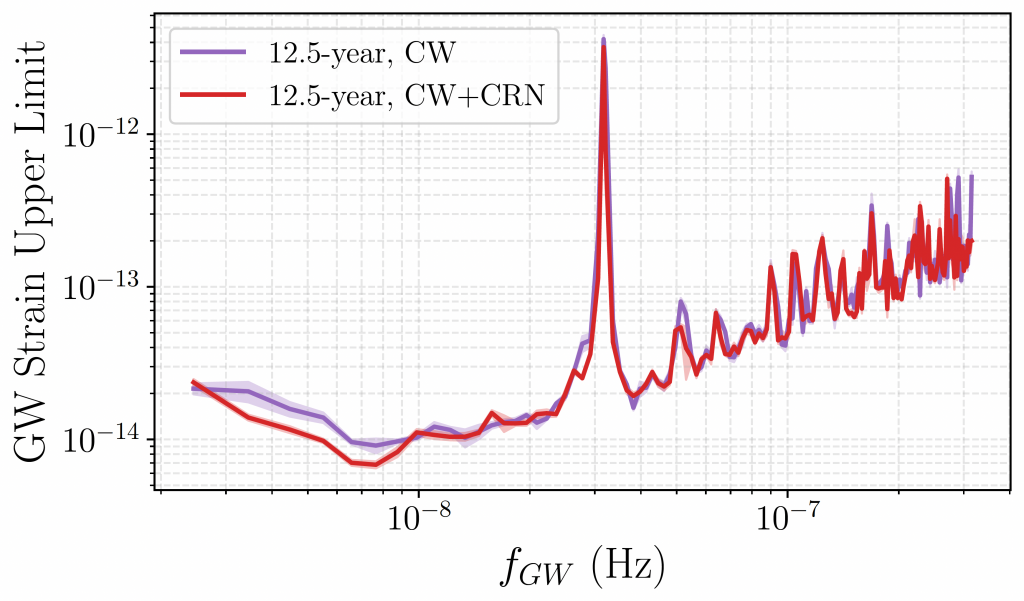
I am very excited to to say that the first NANOGrav paper I am on is out, and it’s a great one! It was led by Caitlin Witt and concerns the search for continuous wave (individually resolved long-lived) gravitational wave sources in the 12.5-year data.
Key figures: