A Bayesian Analysis of SDSS J0914+0853, a Low-mass Dual AGN Candidate
Foord, Adi; ; Reynolds, Mark T.; et al.
The Astrophysical Journal, Volume 877, Issue 1, article id. 17, 13 pp. (2019).
Dual IMBH candidate Chandra
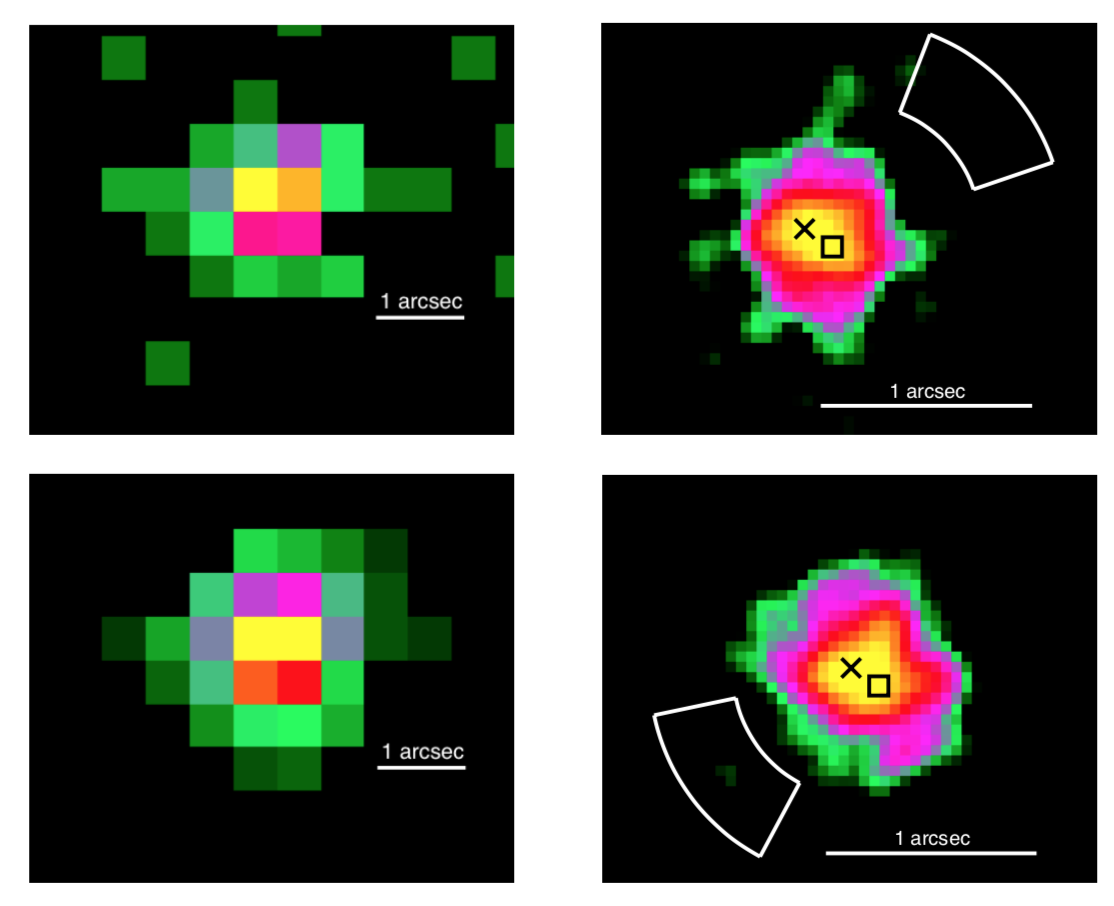
Chandra images of SDSS J0914+0853. Top: 2–7 keV raw (left) and smoothed (right) images of the 15 ks archival observation (Obs ID: 13858). The total number of 2–7 keV counts shown is 257. The smoothed image has been reprocessed using the Energy-Dependent Subpixel Event Repositioning (EDSER; Li et al. 2004) algorithm, and binned by a tenth of the native pixel size. The location of the asymmetry in the Chandra PSF is ≈ 0.7 arcsec from the central position of the AGN, and is outlined by a white polygon. For both datasets, we mask the photons from this region before running BAYMAX. There appear to be two regions of X-ray emission (denoted by a black ”x” and a black square) separated by ∼0.3 arcsec. Bottom: 2–7 keV raw (left) and smoothed (right) image of our new 50 ks observation (Obs ID: 19464). The total number of 2–7 keV counts is 484; the smoothed image has been reprocessed similarly to the archival dataset. We plot the spatial location of the primary (black ”x”) and secondary (black square) AGN, given the 15 ks observation. Although the archival dataset appears to have X-ray emission associated with two point sources, the new dataset has emission that more closely resembles a single point source.
Chandra X-ray spectrum of dual IMBH candidate
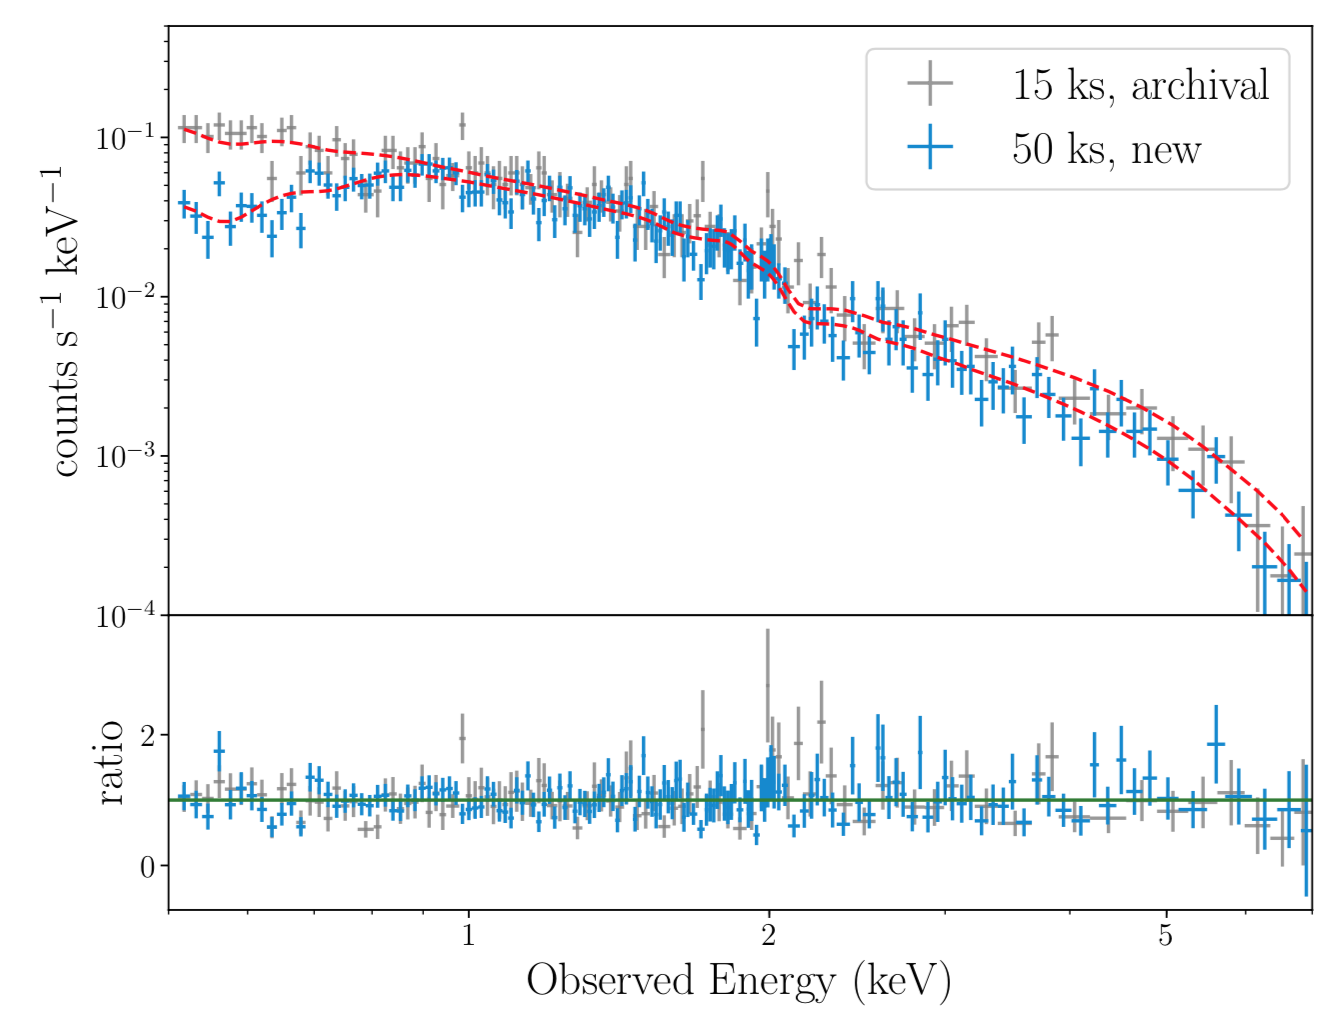
Top: The observed 0.5–7.0 keV Chandra spectrum of SDSS J0914+0853 is shown for both the 15 ks archival observation (grey points) and our new 50 ks observation (blue points), where the data have been folded through the instrument response. Both spectra appear to have a soft excess component, a feature seen in many narrow-line Seyfert 1 AGN. We fit the spectrum with the model phabs×zphabs×(zpow+zbbody), fixing the Galactic absorption and redshift parameters at NH = 4.0× 10^{20} cm^{−2} and z = 0.14. For each dataset, the best-fit models are shown in red. We list the best-fit values for each model in Section 3.2, defined as the median of the distribution. Because our analysis with BAYMAX is restricted to the 2–7 keV photons from SDSS J0914+0853, our results are not affected by the soft emission component in the spectrum. In particular, although we detect variability between the two observations in the low-energy band, the 2–10 keV fluxes are consistent with one another when we fit each spectra independently between 2–7 keV with an absorbed power law. Bottom: Ratio of the data to the continuum model for SDSS J0914+0853. The spectrum has been rebinned for plotting purposes.
dual AGN baymax results
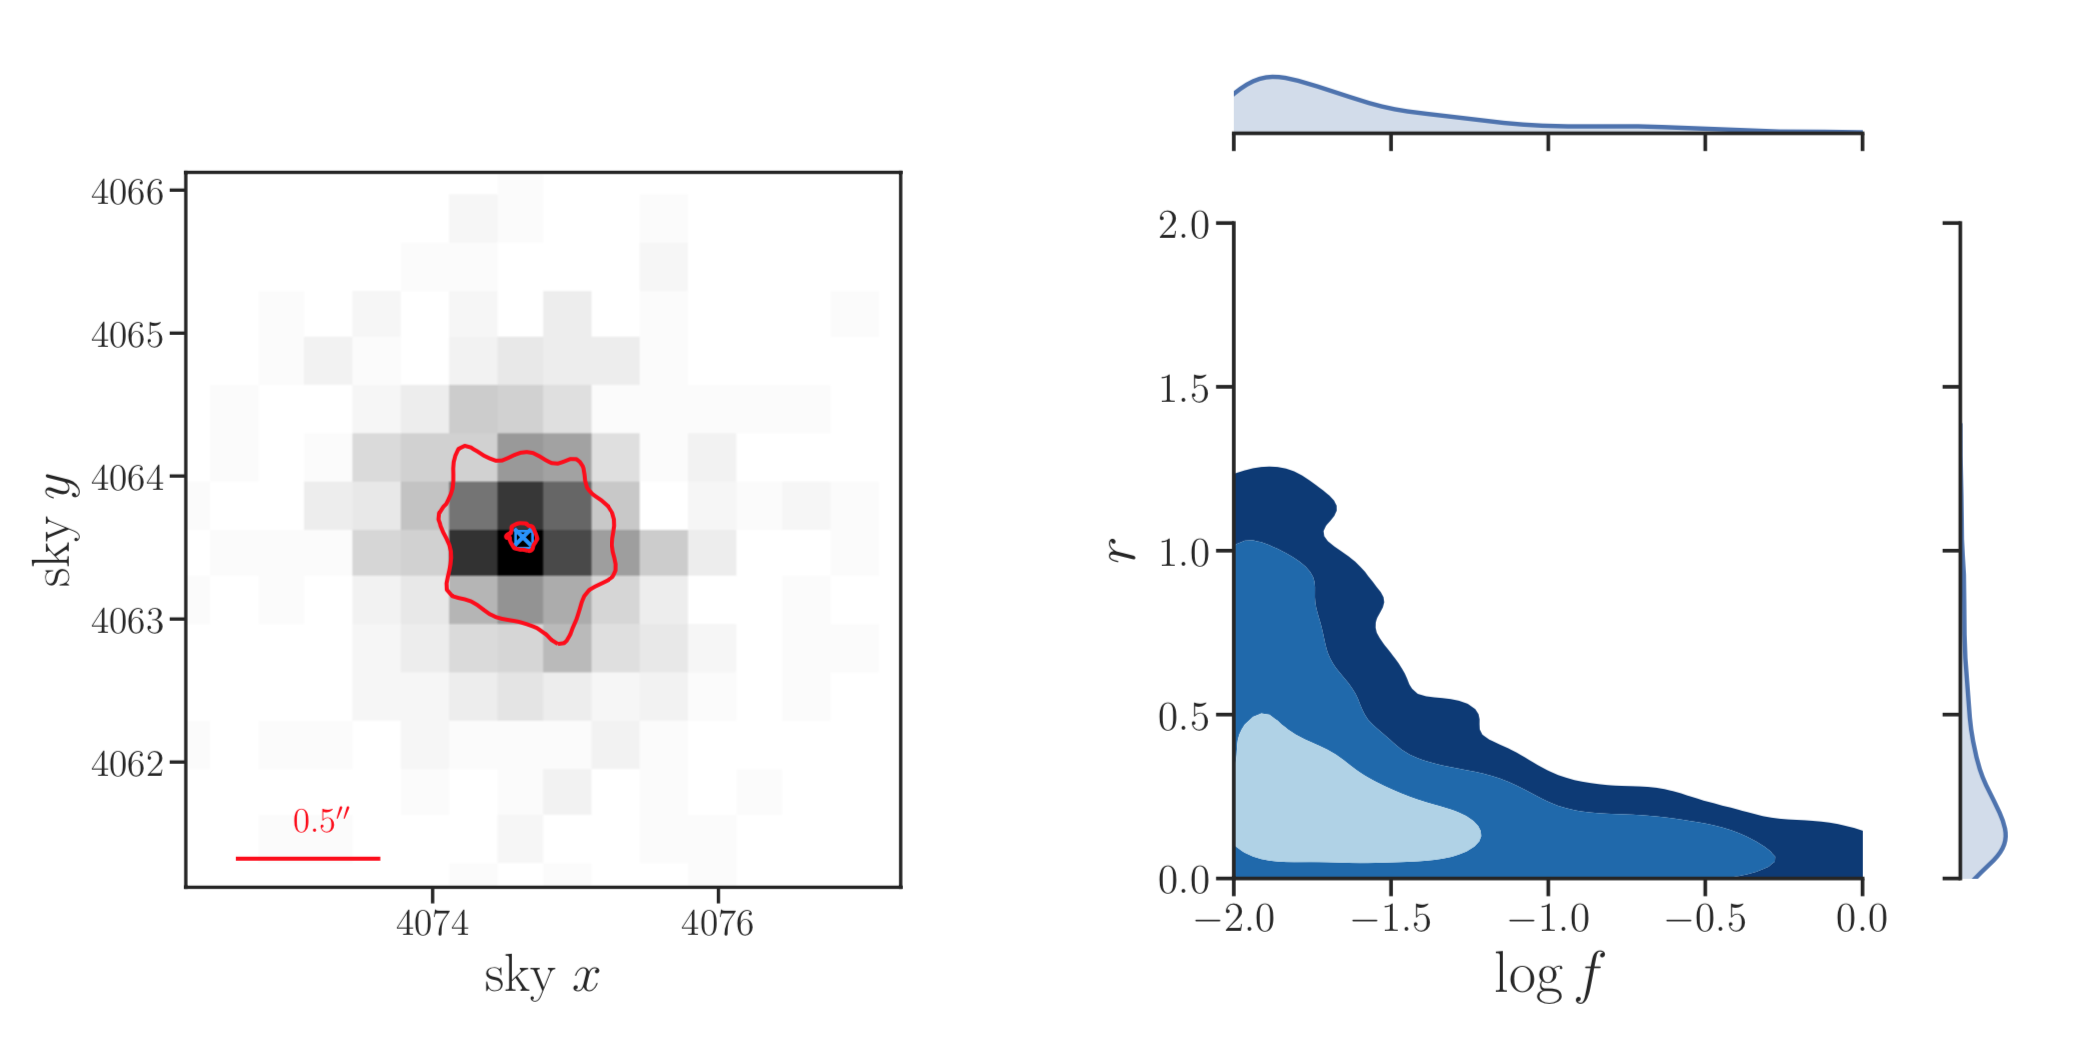
Left: The combined 2–7 keV dataset (723 counts) for SDSS J0914+0853, with the best-fit sky x and sky y positions for a primary (μP, blue “x”) and secondary (μS, blue square) AGN, and the respective 68% and 95% confidence intervals (red lines). In order to more clearly see the results, we show a smaller area than shown in Fig. 1 (however, the binning of data remains the same). The spatial positions of the primary and secondary AGN are consistent with one-another. Right: Joint posterior distribution for the separation r (in arcseconds) and the flux ratio (in units of log f ), with the marginal distributions shown along the border. 68%, 95%, and 99.7% confidence intervals are shown in blue contours. At the 99.7% confidence level, SDSS J091449 has a separation and flux ratio consistent with zero. We note that this particular joint-distribution shape is consistent with a single AGN, where at very large flux ratios the system is likely to have r = 0, and at very large separations the system is likely to have log f = −2.
The first results from BAYMAX (Bayesian AnalYsis of Multiple AGN in X-rays) show that SDSS J0914+0853 is most likely a single AGN, despite appearances to the contrary from initial Chandra X-ray data. This is just the beginning from BAYMAX.