kg
  • Home
  • Research
  • Group
  • CV
    • Publications
    • Grants & Awards
    • Talks
  • News
  • Contact
  • Home
  • Research
  • Group
  • CV
    • Publications
    • Grants & Awards
    • Talks
  • News
  • Contact

VLA

  • Home
  • Research
  • Category: VLA
  • Announcements
  • BAYMAX
  • Binary SMBH
  • Black Hole Mass
  • Chandra
  • COS
  • Dual AGN
  • gravitational waves
  • HST
  • Magellan
  • Meetings
  • NANOGrav
  • Observational
  • Optical
  • Radio
  • Reverberation Mapping
  • STIS
  • Swift
  • Tests
  • Theory
  • UV
  • UVOT
  • VLA
  • WFC3
  • X-ray
  • X-ray
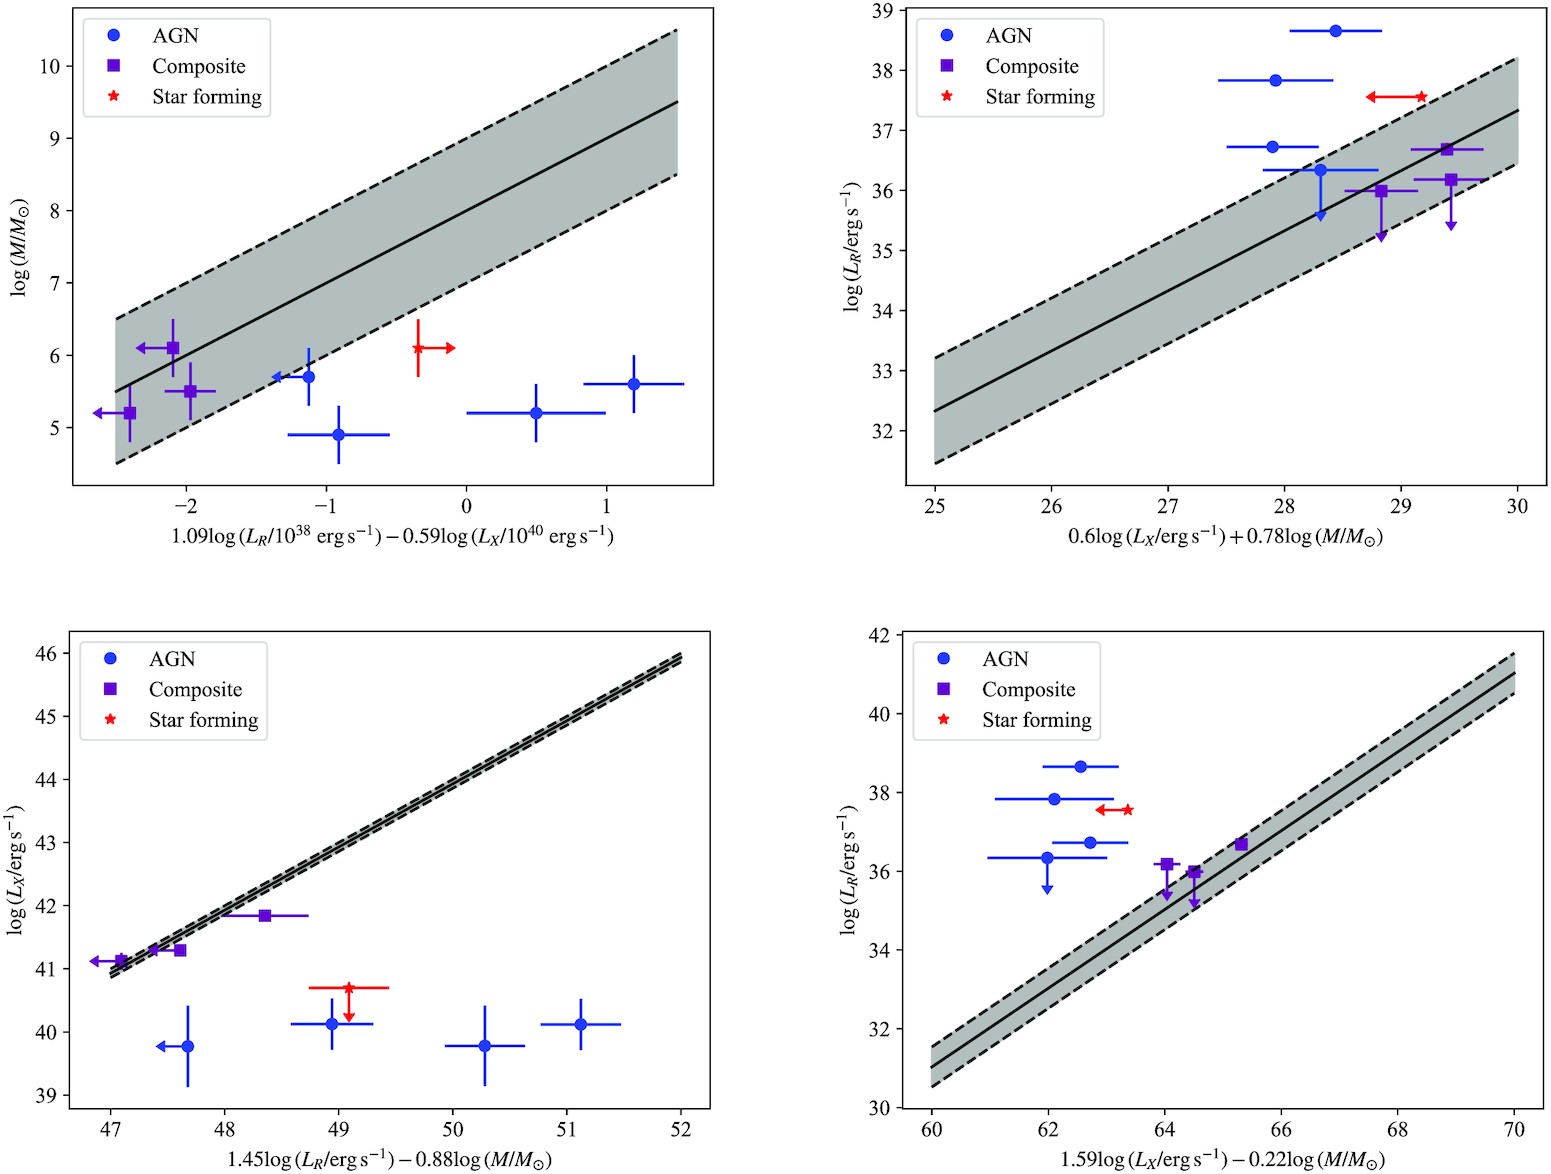
4 panels showing various fundamental plane fits with data that mostly disagree.

High-Eddington Rate IMBHs Do Not Fall on the Fundamental Plane

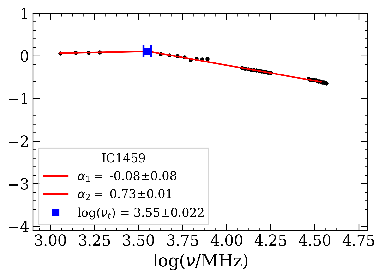
Figure showing log of flux density in Jy as a function of log of frequency in MHz. The y-axis ranges from -4 to 1. The x-axis ranges from 3.0 to 4.75. The data from x = 3.0 to 3.505 are flat at about y = 0. The data from x = 3.505 to 4.6 are going down. The legend indicates that the source is IC 1459, that the low-frequency spectral index is -0.08 +/- 0.08, the high-frequency spectral index is 0.73 +/- 0.01, and the log of the turnover frequency is 3.55 +/- 0.022.

Turnover Frequency

Three-dimensional view of fundamental plane of black hole accretion. A cube is labeled with the following orthogonal axes and limits. X-axis: Radio [erg/s] 30–45; Y-axis: X-ray [erg/s] 30–45; Z-axis: Mass [solar] 0–15. A light blue plane cuts through data points which are clustered as red spheres at the high-mass end and blue cubes and cones at the low mass end.

Measuring black hole masses with X-ray and Radio observations

view more
Kayhan Gültekin

Astrophysicist

About my research

Address:1085 S. University Ave
West Hall 313
Ann Arbor, MI 48109, USA

Phone:+1 734.255.7082

Email:kayhan@figureitout.edu

  • Home
  • Research
  • Group
  • CV
    • Publications
    • Grants & Awards
    • Talks
  • News
  • Contact

HTML5 theme by xBoot, converted to WordPress theme by Kayhan Gültekin