It also doesn’t have any of the required custom fields. Responsive:
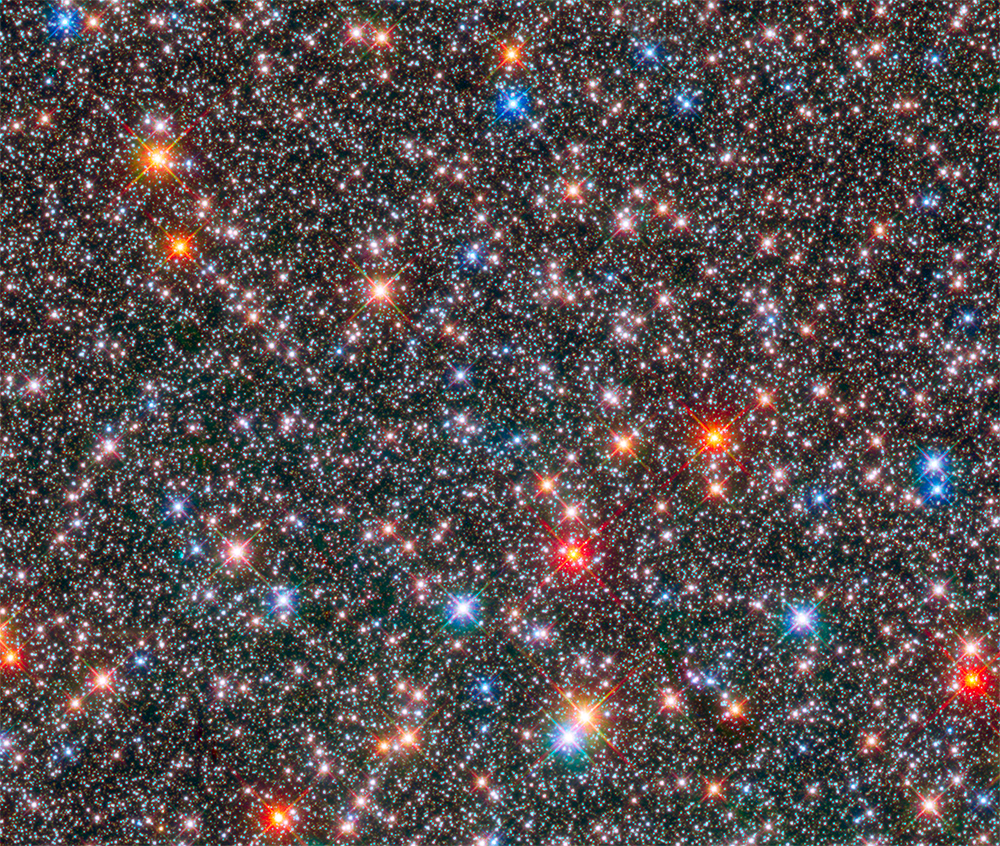
Galaxy Bulge Stars
HST image of Milky Way Bulge
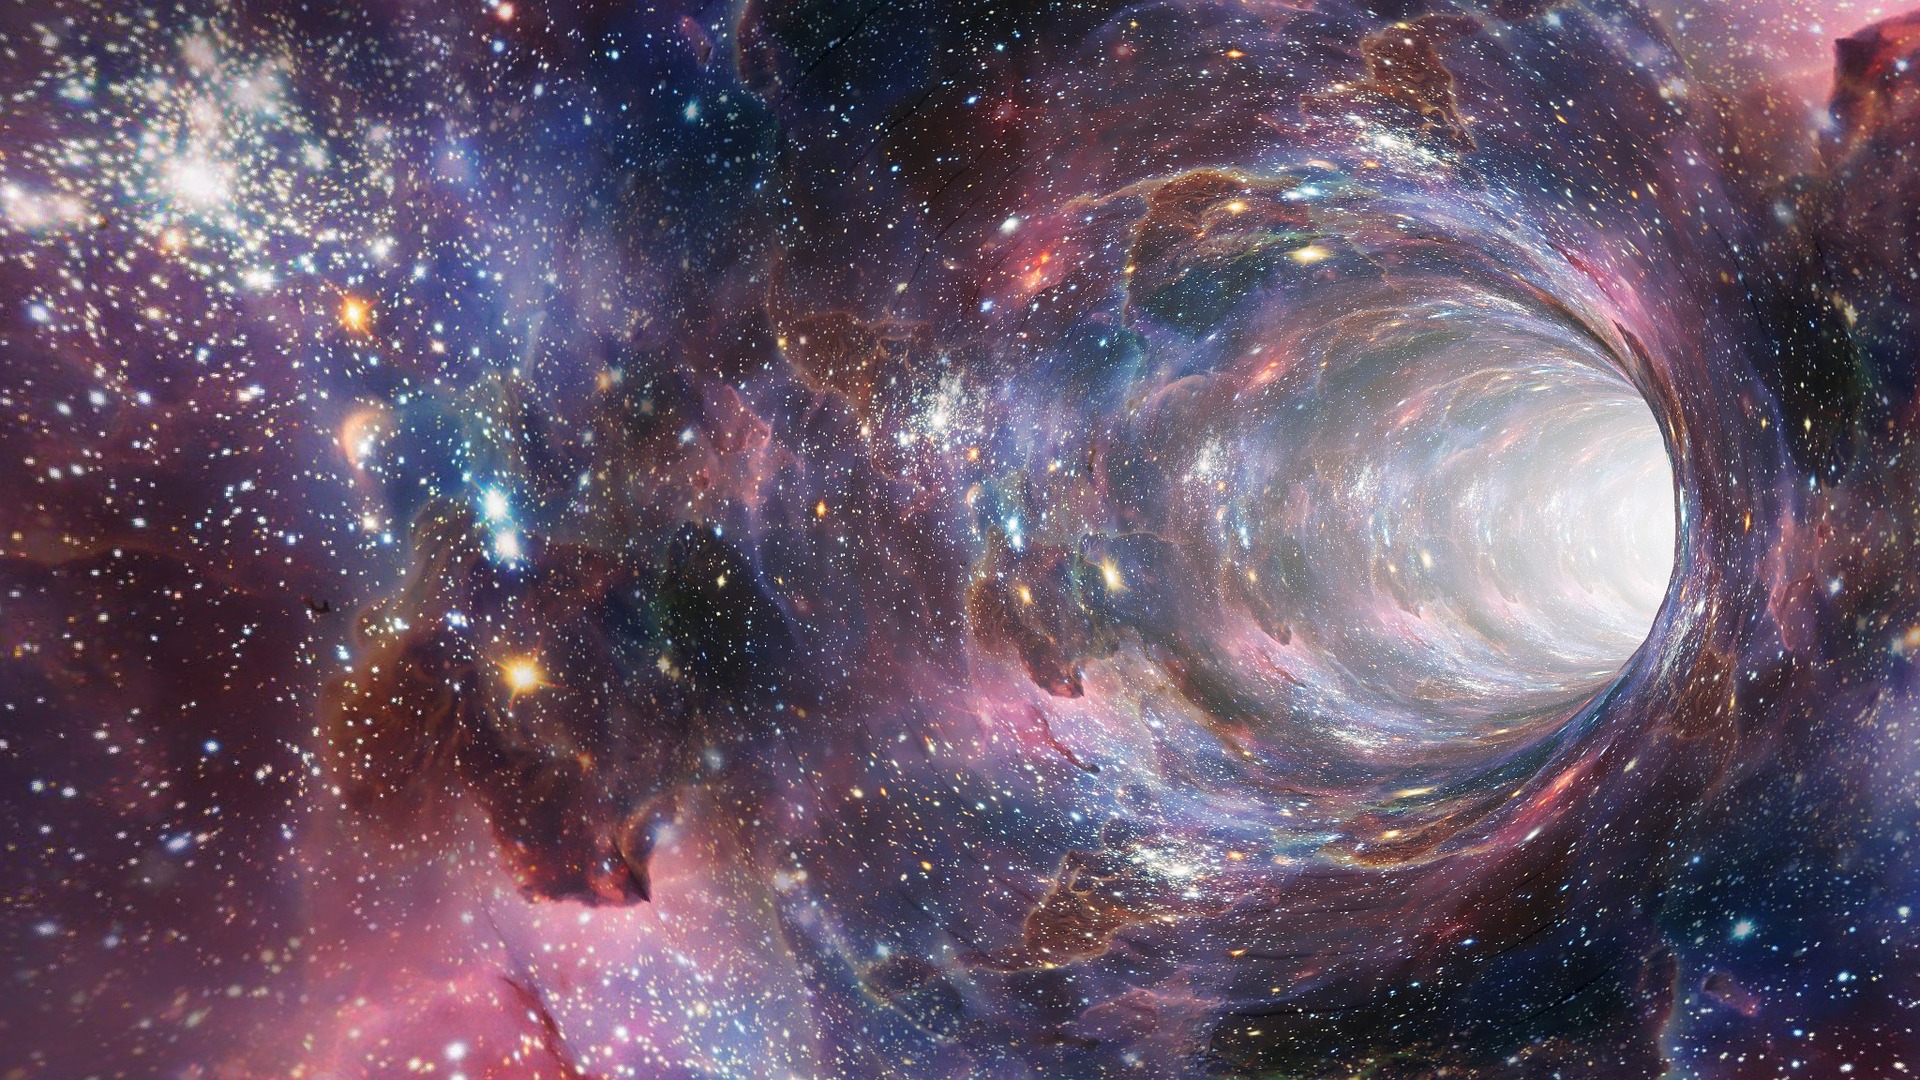
wormhole
Wormholes in space
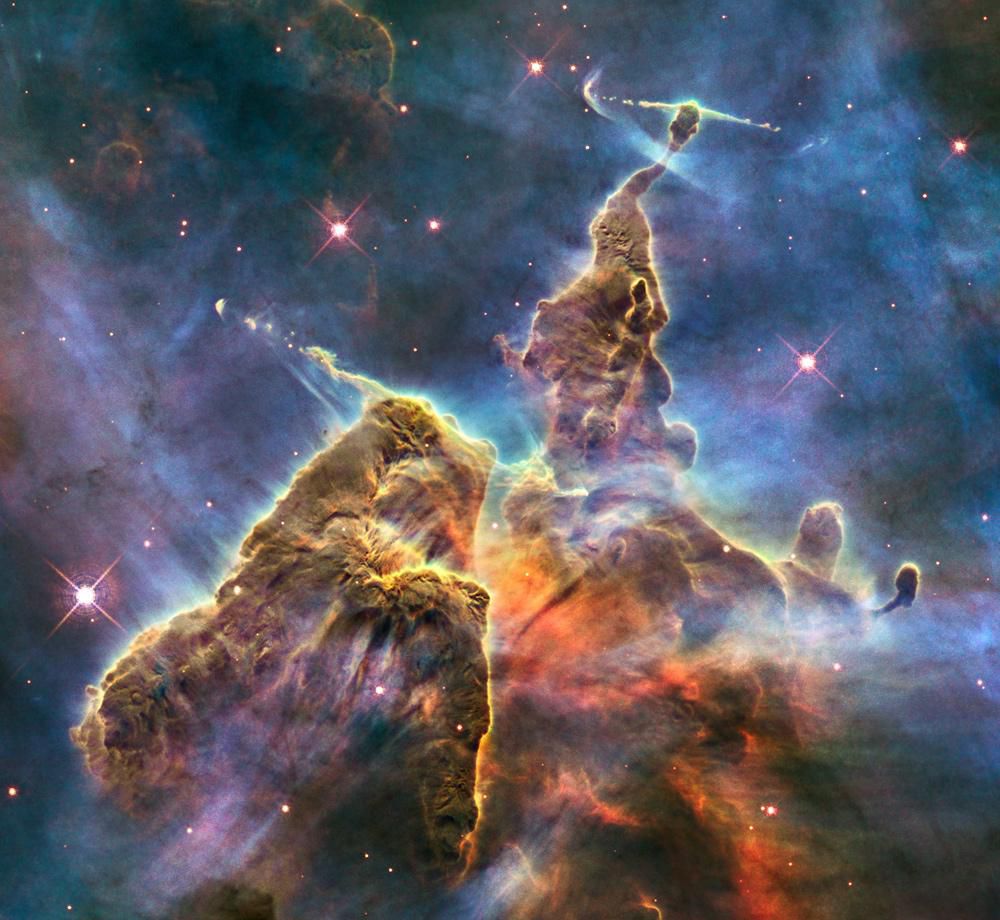
hst_cliche
Viewer:
apjaa9064f2_hr
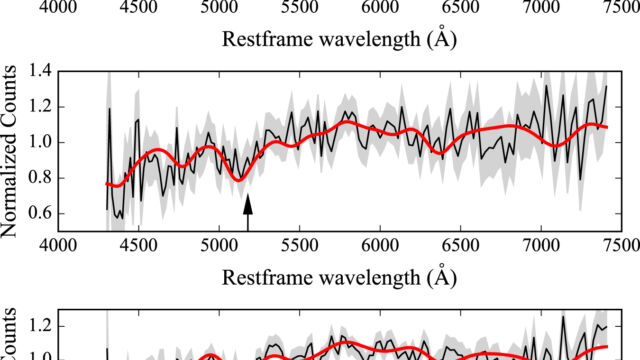
Normalized object spectra (black lines) and the 68% confidence intervals on the observed spectrum fluxes (gray shaded areas) shown for A2261 knots 1, 2, and 3 from top to bottom, respectively. The best fits obtained for each knot are shown as red lines. The arrow indicates the rest-frame wavelength of the Mgb spectral feature.
rupke_etal_2017_fig_14
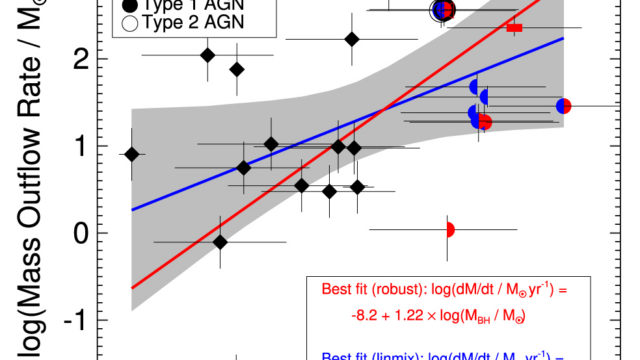
Fig 14 from Rupke et al. (2017). Shows a positive correlation between log outflow mass and log black hole mass.
Turkey Trot 2017
Turkey Trot 2017
What we have here is communication to fail. Justified:
Galaxy Bulge Stars
HST image of Milky Way Bulge
apjaa9064f2_hr
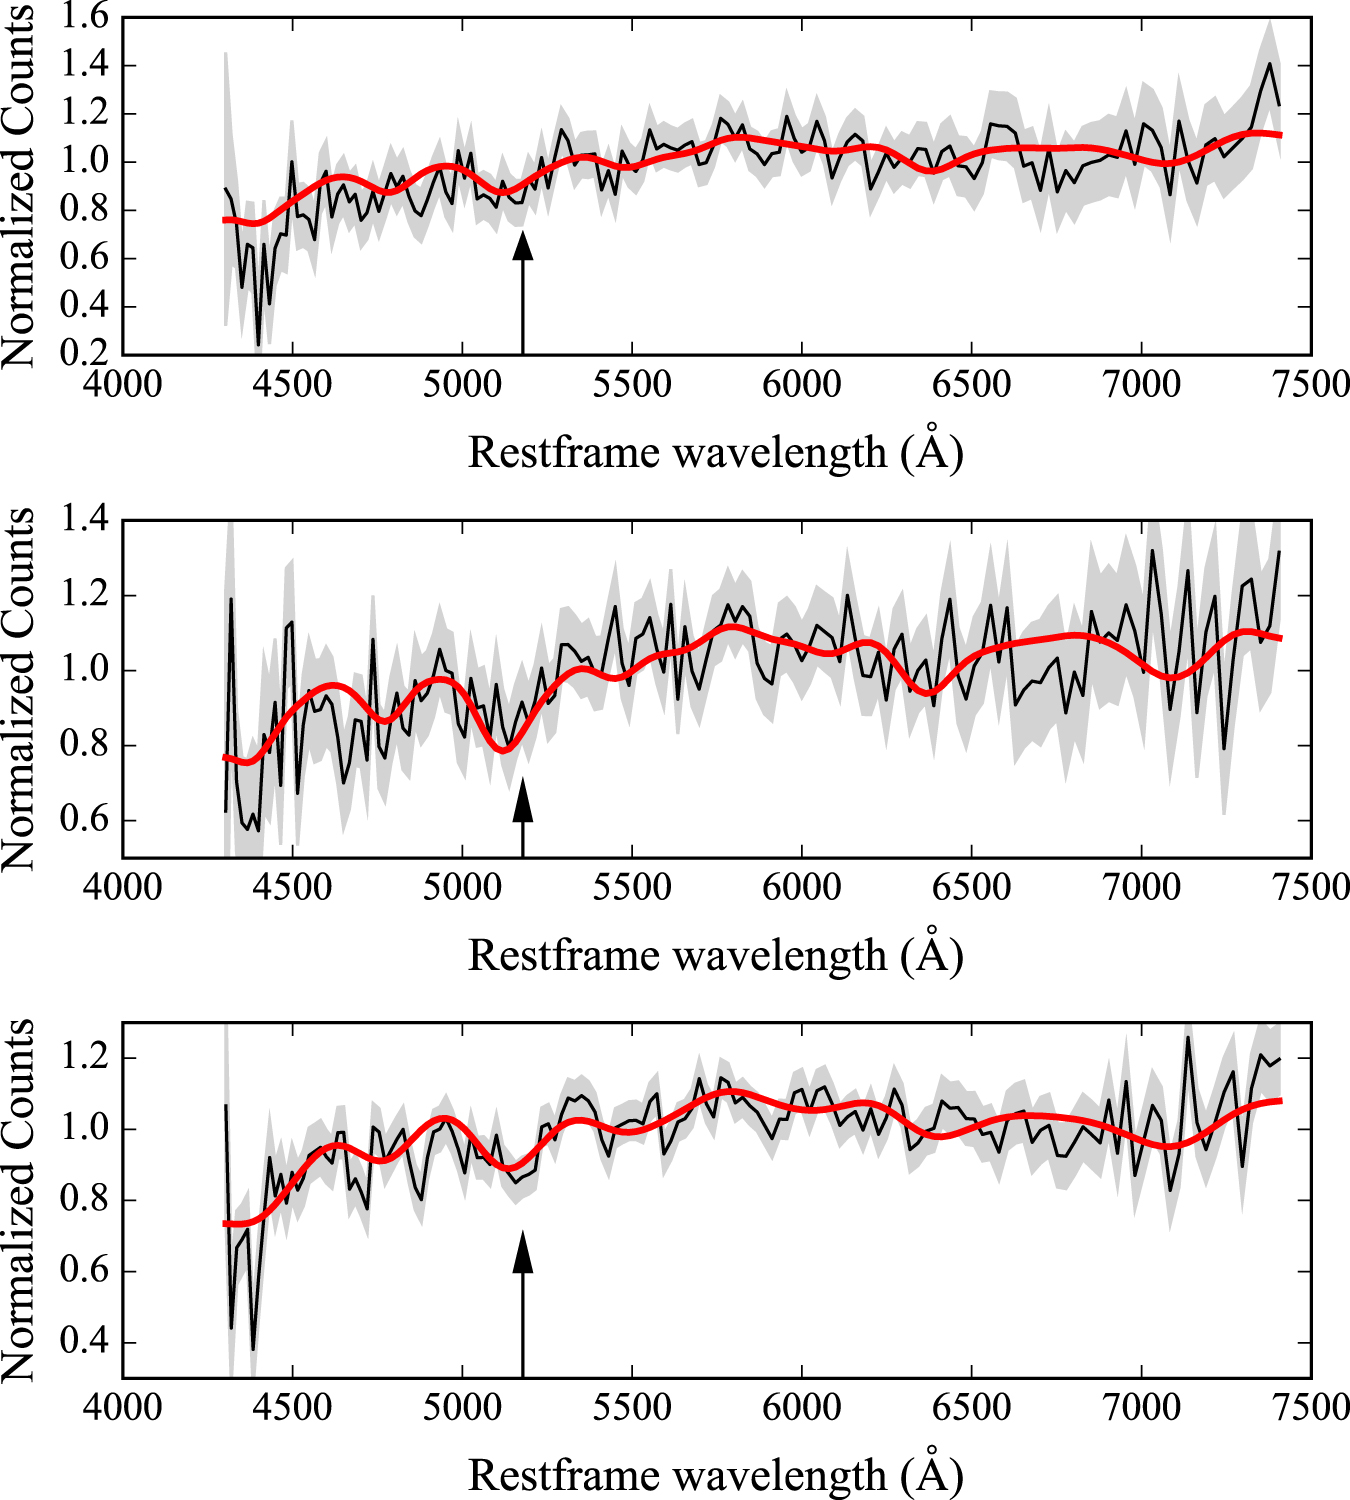
Normalized object spectra (black lines) and the 68% confidence intervals on the observed spectrum fluxes (gray shaded areas) shown for A2261 knots 1, 2, and 3 from top to bottom, respectively. The best fits obtained for each knot are shown as red lines. The arrow indicates the rest-frame wavelength of the Mgb spectral feature.
rupke_etal_2017_fig_14
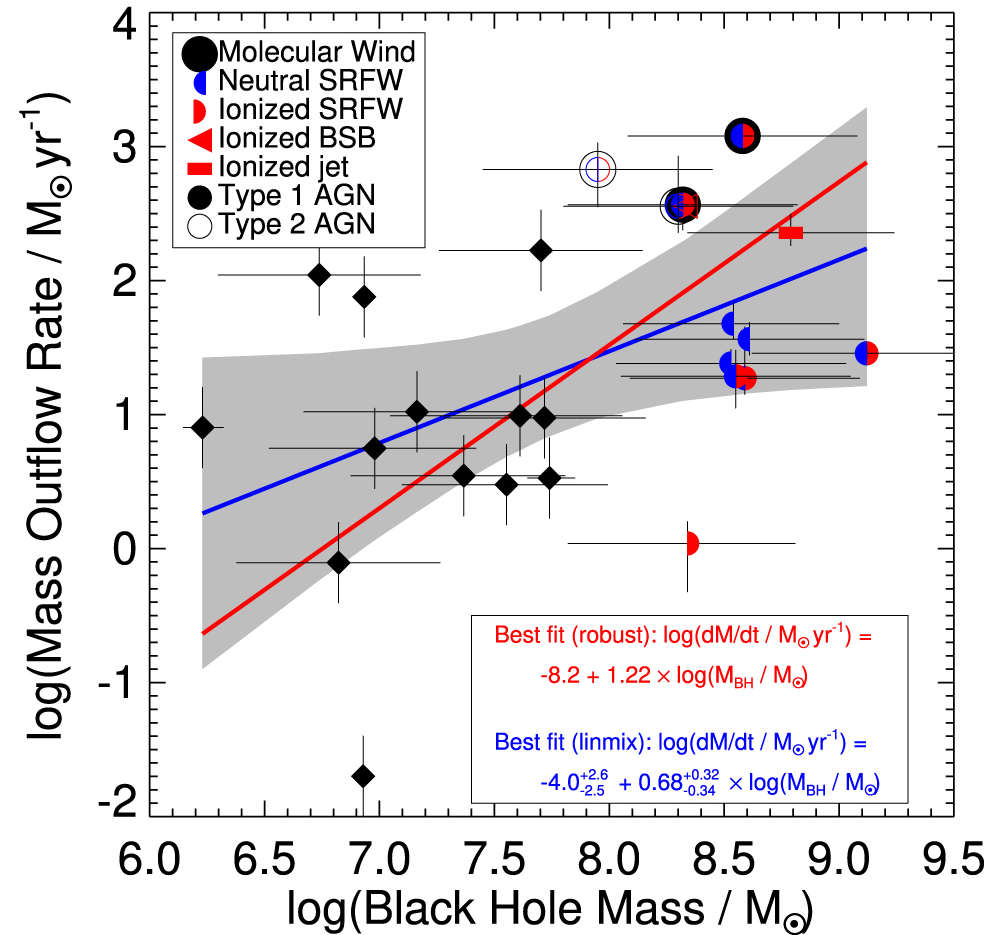
Fig 14 from Rupke et al. (2017). Shows a positive correlation between log outflow mass and log black hole mass.
Next is this masonry one:

Espresso
rupke_etal_2017_fig_14
Fig 14 from Rupke et al. (2017). Shows a positive correlation between log outflow mass and log black hole mass.
Galaxy Bulge Stars
HST image of Milky Way Bulge
apjaa9064f2_hr
Normalized object spectra (black lines) and the 68% confidence intervals on the observed spectrum fluxes (gray shaded areas) shown for A2261 knots 1, 2, and 3 from top to bottom, respectively. The best fits obtained for each knot are shown as red lines. The arrow indicates the rest-frame wavelength of the Mgb spectral feature.
Next is this one Simple:
rupke_etal_2017_fig_14
Fig 14 from Rupke et al. (2017). Shows a positive correlation between log outflow mass and log black hole mass.
Galaxy Bulge Stars
HST image of Milky Way Bulge
apjaa9064f2_hr
Normalized object spectra (black lines) and the 68% confidence intervals on the observed spectrum fluxes (gray shaded areas) shown for A2261 knots 1, 2, and 3 from top to bottom, respectively. The best fits obtained for each knot are shown as red lines. The arrow indicates the rest-frame wavelength of the Mgb spectral feature.
Finally this single thumbnail:
Galaxy Bulge Stars
HST image of Milky Way Bulge
apjaa9064f2_hr
Normalized object spectra (black lines) and the 68% confidence intervals on the observed spectrum fluxes (gray shaded areas) shown for A2261 knots 1, 2, and 3 from top to bottom, respectively. The best fits obtained for each knot are shown as red lines. The arrow indicates the rest-frame wavelength of the Mgb spectral feature.